Every summer, one or two med students show up at my door looking for help with a research project. They get sent to me by the radiologist they happen to be doing the project for, because I’m the Guy That Knows Stuff about image and data analysis (usually more than they know at any rate).
A few years ago (2001-ish or so), I helped out a med student on an interesting project that eventually became a poster that was accepted at an SNM meeting. A paper was written up and was submitted to JNM but ended up getting rejected for whatever reason.
So, for the sake of posterity and in the hopes that someone else might notice it, or have a similar idea, here is the paper that was submitted.
Note, this version has not undergone any form of peer review, other than being reviewed and edited by the authors. This is the latest version of the paper that I have, and there may have been revisions of some kind made in response to reviewer/editor comments when the paper was originally submitted. Those changes may or may not have made it into this version you see here. Questions and comments about this paper are welcome.
Dual Phase Tc-99m Sestamibi Imaging: Its Utility in Parathyroid Hyperplasia and Use of Immediate/ Delayed Image Ratios to Improve Diagnosis of Hyperparathyroidism
Abstract
Objective: Dual-phase Tc-99m sestamibi (MIBI) imaging is the technique of choice for hyperparathyroidism (HPT), especially for localizing parathyroid adenomas. Prior studies show its utility for detecting hyperplasia is equivocal. Quantitation to differentiate benign cases from hyperplasia and adenoma is introduced as a ratio between immediate and delayed images of counts/pixel (I/D ratio). This ratio should be significantly higher in benign parathyroid vs. hyperplasia. Method: Anterior pinhole and upper thorax images with a LEHR collimator at 20 minutes and again at 2 hours after sestamibi injection were obtained in 53 subjects. Retrospective interpretation of the scans as hyperplastic, adenomatous, or benign by a reader blinded to all data was based on the persistence of diffuse activity in two or more foci, a solitary focus, or no activity on the delayed images. These were compared to pathology when available. Regions of interest over the thyroid and background were drawn on immediate and delayed anterior pinhole images, and background subtracted counts/pixel were calculated. Immediate/delay ratios (I/D ratio) were computed for all scans and average ratios were calculated for each type of pathology (benign, hyperplasia, and adenoma). The resulting ratios were analyzed with a t-test to determine significant differences between ratios. Results: Sensitivity and specificity were for parathyroid hyperplasia. Mean I/D ratios were 2.26±0.68, 2.80±0.95, and 3.10±0.77 for subjects with hyperplasia, adenoma, and benign parathyroid respectively (hyperplasia vs. benign P=0.020, adenoma vs. benign P=0.381, hyperplasia vs. adenoma P=0.033. Thyroid ratio data was found to be somewhat independent of the time delay between immediate and delay image acquisition. Conclusion: Dual phase Tc-99 sestamibi imaging is more sensitive and specific for parathyroid hyperplasia than previously reported, supporting its use to localize hyperplastic glands preoperatively and help guide resection. A thyroid ratio between immediate and delayed images will aid in distinguishing hyperplasia from benign parathyroid in uncertain cases.
Keywords: hyperparathyroidism; 99mTc sestamibi; dual-phase parathyroid imaging
Introduction
Primary hyperparathyroidism has an incidence of 100-200/100,000 in the general population. The etiology is unknown, but, data from parathyroid ademomas and hyperplastic glands support a genetic cause linked to chromosome 11, which is also implicated as the cause of MEN I. Ninety-five percent of cases of primary hyperparathyroidism are caused by an adenoma (80-85%) or hyperplasia (10-15%)1. Adenomas are nearly always solitary. Hyperplasia usually involves all four glands, but can involve two or three and occur with varying degrees of asymmetric glandular involvement. Secondary hyperparathyroidism is another cause of parathyroid hyperplasia, often resulting from chronic hypocalcemia in the setting of renal failure and resolving when the hypocalcemia is corrected as with renal transplant. However, transplant failure can result in recurrent hyperparathyroidism that may require parathyroid removal2.
Parathyroid imaging is important for preoperative localization of hyperfunctioning parathyroid tissue. Originally advocated for patients who underwent previous neck exploration and had persistent or recurrent hyperparathyroidism, preoperative parathyroid imaging has proven to be beneficial for identification hyperfunctioning glands because it reduces operative time, costs, and failure rates. Past imaging techniques have involved Tl-201 and Tc-99m pertechnetate, and Tc-99m sestamibi with I-123. Currently, a single radionuclide, dual-phase Tc99m sestamibi imaging protocol is accepted as the standard for localizing hyperfunctioning parathyroid tissue given its combined sensitivity and cost effectiveness3,4,5. Tc-99m sestamibi (Cardiolite; DuPont Pharma, Billerica, MA) has a high affinity for thyroid and parathyroid tissue and a clear differential washout between thyroid and parathyorid tissue. Studies using this technique for initial preoperative detection of parathyroid adenomas have shown sensitivites and positive predictive values ranging from 82-100% and 89-100% respectively. However, results from studies using dual phase Tc-99m sestamibi for preoperative diagnosis of parathyroid hyperplasia have been poor with sensitivities ranging from 37-80%6,7,8. One group reported a sensitivity of 84% recently for detecting adenomas using a criterion whereby two or more foci of prolonged retention of radiotracer was interpreted as hyperplasia9.
We believe dual-phase Tc-99m sestamibi to be more sensitive than previously reported for parathyroid hyperplasia. Thus, we designed a study with two purposes. First, we aim to show dual phase Tc-99m sestamibi imaging is more sensitive than previously reported using a larger patient population than has been used in the past and using more updated interpretive criteria. Secondly, a quantitative ratio is introduced using a thyroid region of interest on the immediate and delayed images to differentiate between parathyroid hyperplasia, parathyroid adenoma, and benign parathyroid when the diagnosis is unclear from image interpretation alone. The immediate/delay image ratio (I/D ratio) is expected to be different for benign, hyperplastic, and adenomatous parathyroid. At 10-15 minutes after injection, there is uptake of Tc-99m sestamibi in both the thyroid and parathyroid glands. Since sestamibi washes out of the thyroid much faster than the parathyroid, the I/D ratio for a benign parathyroid scan should be fairly high and greater than one. In cases of parathyroid hyperplasia, residual activity in the parathyroid glands would result in slightly higher activity during the delayed imaging, resulting in a slightly lower I/D ratio. For parathyroid adenomas, small intense regions of focal uptake would result in higher residual activity, and therefore lower I/D ratio compared to the benign case but higher than the hyperplasia case. The expected values for the I/D ratio are summarized in Table 1.
| Disease | I/D Ratio |
|---|---|
| Benign | >> 1 |
| Hyperplasia | > 1 < benign |
| Adenoma | > 1 > hyperplasia < benign |
Materials and Methods
A retrospective study of 54 patients (34 female, 20 male) who underwent dual-phase Tc-99m sestamibi imaging in our nuclear medicine department between February 1997 to March 2001 was performed. The average age of patients was 53.3±15.6 years (range 16-86 years). There were 8 (14.8%) benign cases (normal scan or negative pathology) including, 21 (38.9%) parathyroid hyperplasia (positive pathology or positive scan) and 25 (46.3%) parathyroid adenoma (positive pathology).
Dual Phase Parathyroid Imaging Protocol
Parathyroid images were acquired using a dual phase imaging protocol with patients receiving 740 MBq (20 mCi) Tc-99m sestamibi. Images were acquired at 20 minutes (immediate phase) and 2 hours (delay phase) post injection. Immediate phase imaging consisted of a 5 minute anterior pinhole image followed by a 5 minute image of the upper thorax using a low-energy, high-resolution parallel hole collimator. Imaging for the delay phase consisted of the same acquisitions as for the immediate phase plus additional 5 minute right and left anterior oblique pinhole images. All images were acquired using a 256×256 matrix on a dual head gamma camera (Picker PRISM 2000, Marconi Medical Systems, Cleveland, OH).
Images of all patients were retrospectively interpreted by a board certified nuclear medicine physician blinded to the clinical diagnosis and histopathology results when applicable. Scans were interpreted for hyperfunctioning parathyroid tissue as follows: prolonged retention of radiotracer on the delayed images relative to thyroid activity appearing as a solitary focus was interpreted as an adenoma; two or more foci of persistent radiotracer activity on delayed images as hyperplasia; no radiotracer retention on delayed images relative to thyroid activity was considered a normal scan/benign parathyroid.
Bilateral neck exploration and parathyroidectomy was performed on 46/54 patients. Resected parathyroid tissue specimens were submitted for pathological examination to obtain a definitive diagnosis. A scan was considered true positive if it showed a solitary focus of activity on delayed imaging corresponding to the location of the adenomatous tissue resected and found to be parathyroid adenoma on histopathology, or if it showed multiple foci of activity on delayed imaging corresponding to the locations of hyperplastic tissue resected and found to be hypercellular parathyroid on histopathology. Scans were also true positive if no activity focus was seen and parathyroidectomy was performed anyway, and specimens were found normal by histopathology.
Thyroid ROI Analysis
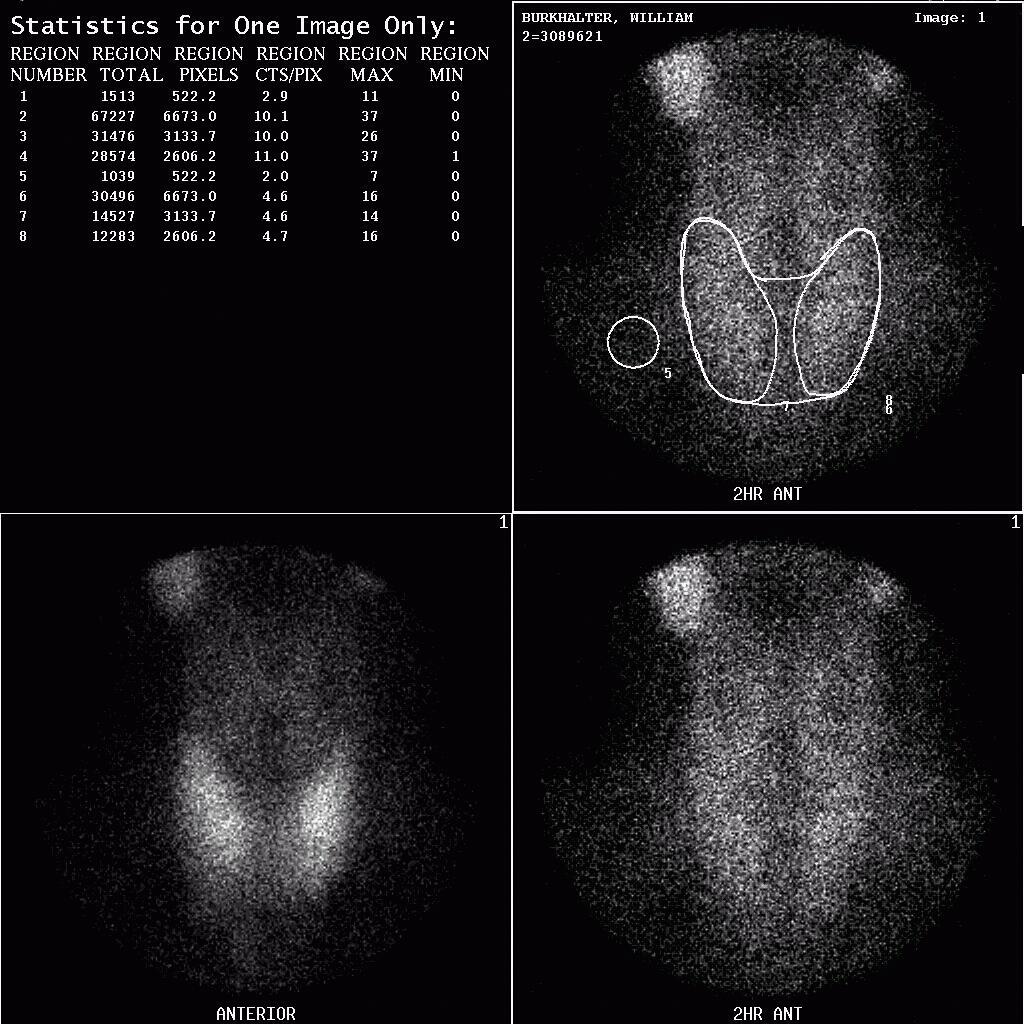
Images were analyzed using the Picker Odyssey (Marconi Medical Systems, Cleveland, OH) workstation platform. Only the immediate and delay anterior pinhole images were analyzed for this study. Regions of interest (ROI) were drawn over the thyroid on the immediate and delayed images (Figure 4). The counts per pixel were calculated and background subtraction was performed for each region. An I/D ratio was calculated by dividing the background subtracted immediate thyroid region counts/pixel by the background subtracted delay thyroid region counts/pixel. For each pathology (benign, hyperplasia and adenoma), average I/D ratios were calculated for the thyroid region. The results were analyzed using a two-tailed Student’s t-test to determine the significance of the differences in the ratios between benign and hyperplasia, benign and adenoma, and hyperplasia and adenoma.
Results
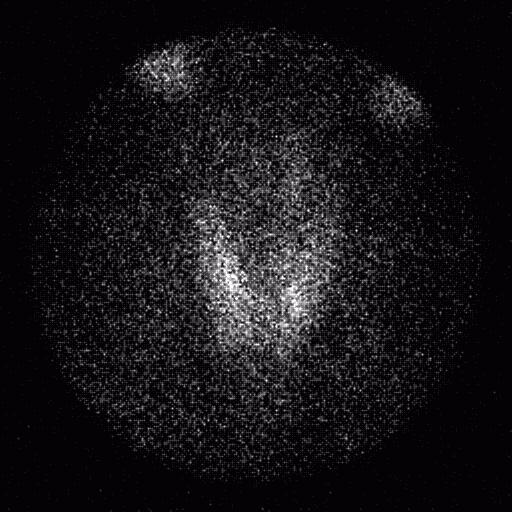
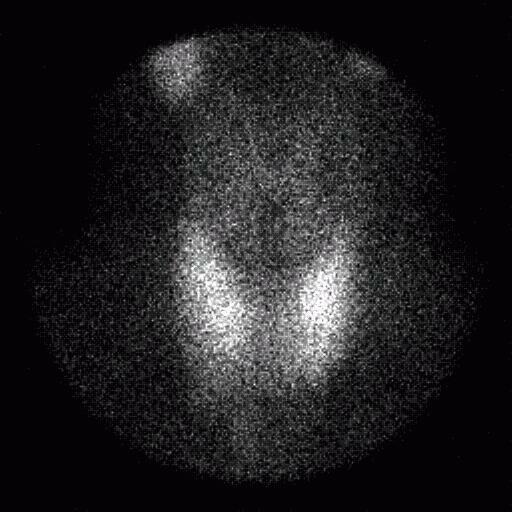
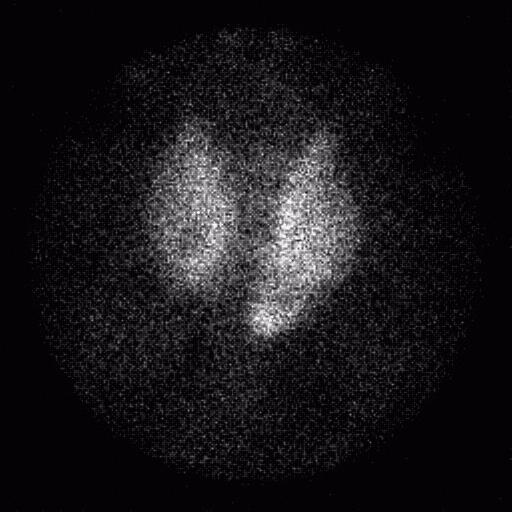
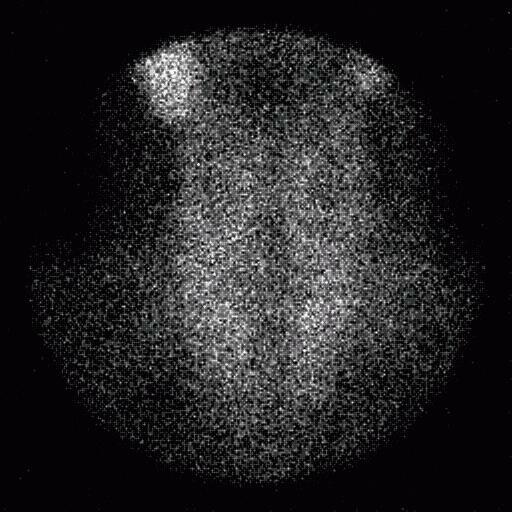
The sensitivity and specificity of dual phase Tc-99 sestamibi parathyroid scans was found to be 82%/96% and 91%/88% for parathyroid adenoma and parathyroid hyperplasia respectively in 46/54 patients who underwent parathyroid resection. Figures 1, 2 and 3 show examples of true positive scans for parathyroid adenoma, hyperplasia, and benign from the study patient population.
The mean I/D thyroid ratio for benign patients was 3.10±0.77 (range 2.40-4.71). As predicted, the mean I/D thyroid ratio for the parathyroid hyperplasia cases was lower (2.26±0.68, range 0.78-3.73) than the benign ratio. For adenoma cases, the mean I/D thyroid ratio was 2.80±0.95 (range 1.07-4.72), also as predicted. Figure 5 shows a graph of the I/D ratio data and illustrates the range in the calculated ratios. Figure 6 shows a bar graph of the immediate/delay ratio for the thyroid region. Error bars in Figure 6 represent ±1 standard deviation. The average ratios from the thyroid region are summarized in Table 2 for the benign, hyperplasia and adenoma groups. A two-tailed Student’s t-test was performed to evaluate whether the differences in the I/D ratios were statistically significant (P < 0.05 considered to be statistically significant). The difference between the I/D ratio was found to be significant for benign parathyroid vs. parathyroid hyperplasia (P = 0.020) and for parathyroid hyperplasia vs. parathyroid adenoma (P = 0.033). The difference in the I/D ratio for benign parathyroid vs. parathyroid adenoma cases was not significant (P = 0.381). Results of the Student t-test are given in Table 3.
Discussion
The sensitivity and specificity we obtained for parathyroid hyperplasia, equal or exceed other studies (6,7,8,9) to date examining the diagnostic utility of dual phase sestamibi parathyroid imaging for parathyroid hyperplasia prior to parathyroidectomy in which imaging findings were correlated with pathology findings. This study is retrospective, but includes the largest number of patients with proven parathyroid hyperplasia who underwent preoperative dual-phase Tc-99m sestamibi imaging. Given the results for parathyroid hyperplasia using the scan interpretation criteria used, and that dual-phase Tc-99m sestamibi imaging is already established as the best imaging tool with regard to cost effectiveness and diagnostic utility for parathyroid adenoma prior to surgery, we believe dual-phase Tc-99m sestamibi imaging as the diagnostic imaging test for localizing hyperfunctioning parathyroid tissue of any type prior to parathyroidectomy.
Our purpose was to establish a quantitative method to corroborate scan interpretation and distinguish adenomas from hyperplasia when scan interpretation was/is uncertain. Although the differences between the I/D ratios were not as large as initially expected, we believe the differences in mean ratios support using this quantitation method to substantiate scan interpretation in uncertain cases. There is considerable variation in the I/D ratios and the overlap in the range made it difficult to determine a precise I/D ratio for each type of pathology. Part of the variation is a result of normal physiologic differences between patients. More importantly, a larger number of patients with benign parathyroid, adenomas, and hyperplasia would decrease the error for the mean ratios and allow calculation of the I/D ratios to be more a robust diagnostic tool for supporting scan interpretation. Patient and camera positioning differences between the immediate and delay acquisitions also cause variation. In some cases, the delayed images were acquired with the camera at a different distance from the patient, or with the patient turned or tilted relative positioning used for the immediate scan. Such differences affect the size and shape of the thyroid region between the two acquisitions.
Another potential source of variation was the time interval between immediate and delay image acquisitions. Although the imaging protocol calls for the delayed images to be acquired two hours post-injection, this was not always possible and some delay images were acquired as long as 3 hours post-injection. The average time between the immediate and delay acquisitions was 1.87±0.36 hours (range 1.20-2.97 hours). Because of the rapid thyroid clearance time reported for Tc-99m sestamibi (27±13 minutes)10, it might normally be expected that increasing or decreasing the interval between immediate and delay acquisitions would affect the I/D ratio. However, a plot of the I/D ratio vs. I/D acquisition interval time (Figure 7) did not appear to be very well correlated. A linear regression analysis performed on the data yielded y = 0.3824x + 1.916 for the line of best fit (R2 = 0.0247), where y was the I/D thyroid ratio and x was the I/D imaging time interval (Figure 6). Thus, the I/D ratio appears to be relatively insensitive to fluctuations in the time interval between immediate and delay image acquisitions. There does appear to be a slight trend towards an increasing ratio as the delay time interval is increased however.
