For the past few months, I’ve been digging through our PACS database extracting all sorts of gory stats on the storage requirements for CT images. After the first of our 64 slice CT scanners was installed and hearing early reports about 1000 slice studies being stored, I started to get curious about the impact of multi-slice/multi-detector CT (MDCT) scans on our PACS archive.
Our PACS archive goes all the way back to 1996 when it was first installed, so there were a lot of numbers to go through.
Here are some graphs summarizing some of what I’ve found so far.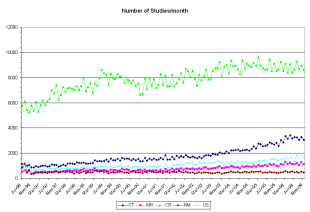
This is the number of studies per month being stored to the archive. Pretty boring, mostly linear growth happening here.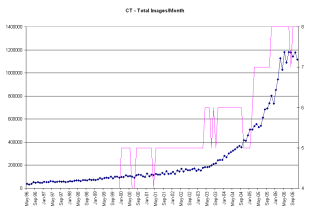
This is the total number of CT images being stored to the archive each month. You can see fairly steady growth early on with a hint of increase starting around 2000, when the first of our 2 and 4 slice CT scanners were getting installed. The big jump in images/study/month starting around 2003 marks the start of five 16 slice CT scanners being installed. You see another slight increase in the number of images/study/month happening around the end of 2004, which marks the installation of the first of two 64 slice scanners, replacing two of the 16 slice scanners.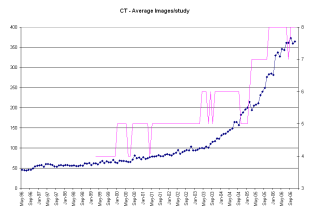
Above is the average number of images per study per month being stored to the archive. You see similar trends going on here as with the total images. With MDCT, you have the ability to scan much larger volumes in the same amount of scan time, so naturally you can generate more images. And in order to generate nice looking coronal and sagittal reformats, you need to scan with thin slices which means even more slices.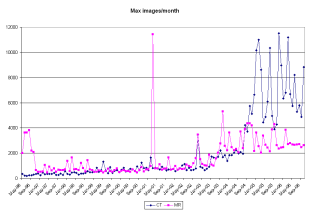
This shows the maximum number of images being stored each month. As you can see from this graph, we are well past the point where thousand image studies were routine and are getting to where some of the largest studies are approaching 10 000 images. Of course the majority of these images are actually reformats and reconstructed images, not actual ‘x-ray on’ scans. The jump in max images around July 2003 coincides with the installation of 4 16 slice scanners.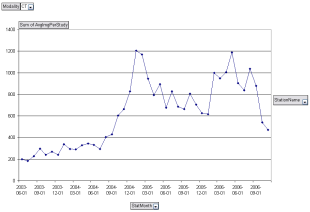
Looking at just one CT room, we see what happens here when the switch is made from 16 to 64 slices. The initial data point is an artifact caused by the vast number of images I sent to the archive from acceptance testing the 16 slice scanner. The unit was replaced with a 64 slice scanner Sept 2004, where you see a slight increase in the average number of images stored each month. Then a few months later once the ‘Wow’ factor has kicked in and people start seeing just what the machine is capable of, zoom goes the average images per study.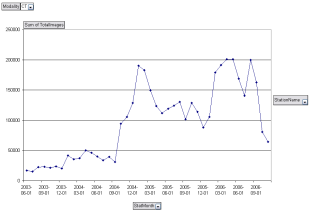
A similar thing, although much more dramatic happens when we look at the total images stored each month for the same room. Following the switch to 64 slices, the total number of images doubles from what was being stored with the 16 slice scanner, partly because of an increased number of patients being scanned, and partly because of more images per study being acquired.
So what does all this mean? With each CT image taking up at least 512 kB a single CT study starts reaching the GB range for storage requirements. This makes the size of the on-line PACS archive in terms of the number of studies it can store becomes smaller. Studies get moved off-line onto tape or MOD sooner. The more MDCT scanners an institution has, the more pronounced this becomes.
Radiologists need new tools for viewing these massive data sets. 3D and volumetric visualization, which used to be considered just eye-candy for referring physicians, becomes essential for making it through the sheer volume of data.
Interesting stuff. I need to write this up and publish it some place.
Discover more from Imablog
Subscribe to get the latest posts sent to your email.