Evaluation of a Triple Energy Window Scatter Correction Method for SPECT Imaging

Back when I was doing my medical physics residency (oh about 6 or so years ago now), I was asked to evaluate a triple-energy window technique for scatter reduction in nuclear medicine imaging. I stashed a copy of what I wrote up over on my other much neglected website and just thought I’d move it over here for storage and posterity. It’s pretty rough and not anywhere near any kind of publishable state, but it was fun to work on and provided a good learning experience.

Objective

To test and evaluate the usefulness of the Triple Energy Window (TEW) method for scatter correction proposed by Ogawa et al.

Background

In a scatter correction method proposed by Ogawa et al1, the number of scattered photons in each pixel is estimated using two energy windows adjacent to the main photopeak window. The number of scattered photons in the photopeak window is determined by calculating the area of the trapezoid underneath the line joining the two scatter windows in the scatter spectrum.

For each pixel in the photopeak projections, the number of scatter counts is determined using the ollowing equation

Cscat ~ (Clower/Ws + Cupper/Ws)*Wm/2

where

Clower = counts in left window
Cupper = counts in right window
Ws = width of left and right scatter windows (keV)
Wm = width of photopeak window (keV)
Cscat = number of scatter counts

Phantom studies and computer simulations performed by Ogawa et al and Ichihara et al2 showed the method could estimate the number of scattered photons fairly accurately. However, neither paper addresses the potential for increased noise when the scatter counts are subtracted.

A Monte Carlo investigation of the method by Ljungberg et al3 questioned the use of the upper (right) scatter window noting that using the right scatter window might make the TEW method more susceptible to noise. When only the lower energy window is used, Clower = 0 and the estimated number of scatter counts becomes

Cmax = (Clower*Wm)/(2*Ws)

Monte Carlo simulations performed by Buvat et al4 demonstrated an 18% overestimate of the scatter counts when both scatter windows were used, and a 14% underestimate of the scatter counts when only the lower scatter window was used. Good relative activity quantification was also demonstrated by the simulations when only the lower window was used.

Equipment

  • Jaszczak phantom with cold rods and spheres
  • ACNP kidney phantom
  • Picker PRISM 3000 triple head SPECT camera

Method

A standard Jaszczak phantom containing the solid rod and spheres inserts was filled with water and 1110 MBq (30 mCi) of Tc-99m. A SPECT acquisition was acquired using three energy windows

  1. Photopeak – 15% window centered at 140 keV.
  2. Scatter1 – 3 keV window centered at 126 keV.
  3. Scatter2 – 3 keV window centered at 153 keV.

with these acquisition parameters: 120 projections, 30 s/projections, 3 degrees/projections and a 128×128 projection matrix. The images from each energy window was stored in a separate file.

The ACNP (American College of Nuclear Physicians) kidney phantom consists of two fillable kidney objects with a cold spot defect located in the middle of the right kidney and superior portion of the left kidney. The objects were filled with approximately 370 MBq (10 mCi) of Tc-99m and placed within a water bath. A SPECT acquisition was acquired using the same energy windows used for the Jaszczak phantom, 120 projections, 30 s/projection, 3 degrees/projection and a 128×128 projection matrix.

Processing

Once the acquisition is complete, there are three files, the photopeak projections, and two scatter projections. The TEW method was performed two different ways; with both scatter windows (TEW2) and with just the lower scatter window (TEW1) as suggested by Ljungberg et al. All image processing was done through the Odyssey software.

TEW2

  1. Divide the counts in each pixel of the scatter projections by the width in keV of the scatter window.
  2. Add the two scatter window projections together.
  3. Multiply the resultant projections by half of the photopeak window width in keV.
  4. Subtract the result from the original projections.

TEW1

  1. Divide the counts in each pixel of the scatter projections from the lower window by the width in keV of the scatter window.
  2. Multiply the resultant projections by half the photopeak window width in keV.
  3. Subtract the result from the original projections.

With the window settings used in this experiment (3 keV scatter windows, 15% (21 keV) photopeak window), the scatter correction using both lower and upper scatter windows was performed by adding the scatter projections together and multiplying the result by a factor of 3.5. The scatter projections were then subtracted from the main photopeak projections. For the TEW1 method, the pixels of the lower scatter window projections were scaled by a factor of 3.5 and subtracted from the photopeak window projections

Reconstruction

A 3 pixel thick slice was reconstructed with a ramp filter through the center of the spheres from each of the corrected and uncorrected projections. To investigate uniformity and noise, a 9 pixel thick slice was reconstructed with a ramp filter through the uniform water section of the phantom. Attenuation correction was applied using the system attenuation correction software and an attenuation coefficient of 0.11 cm-1. No additional postfilters were applied to the reconstructed images.

The ACNP kidney phantom was reconstructed using a ramp filter and single pixel thick slices, and then filtered using a Wiener 3-D postfilter. The filtered images were reformatted to 3 pixel thick coronal and transverse slices. No attenuation correction was applied to the phantom images.

Results and Discussion

The total counts per projection in the ACNP kidney phantom images ranged from 15-20 kcounts in the photopeak window, 1.5-2.6 kcounts in the lower scatter window and 300-600 counts in the upper scatter window. The count loss when both scatter windows were used to estimate the scatter counts in the photopeak window was almost 50% (6-10 kcounts/projection subtracted from the photopeak projections) and around 35% (5-9 kcounts/projection subtracted) when only the lower scatter window was used.

Circular ROIs was drawn through the each sphere of the Jaszczak phantom to obtain the mean counts/pixel within the sphere for the corrected and uncorrected images. The same ROIs were used to obtain the mean counts/pixel from the center of the phantom. The percent contrast for each sphere was calculated using the equation

% Contrast = (bkg counts – ROI counts)/bkg counts

% Contrast
 Uncorrected2 Window1 Window
36 mm809092
31 mm667583
25 mm526869
19 mm496065
15 mm234134

The most noticeable problem with the scatter corrected images is a significant decrease in counts and increase in noise. The inherent noisiness of the ramp filter also contributes to the noise in the reconstructed images. An interesting item to note is the improved contrast when only the single window is used compared to when both windows are used. This suggests that using only the lower scatter window may produce better results as suggested by Ljungberg et al3. Neglecting the higher scatter window for the higher energy photopeak is also recommended by Ogawa to avoid increasing statistical noise.

The additional noise introduced by the TEW scatter correction may be compensated for somewhat by applying a different filter to the projections or postfiltering the reconstructed images.

The slices from the uniform section of the phantom was used to determine the uniformity and noise of the corrected and uncorrected slices. The mean, standard deviation, maximum and minimum counts per pixel from a 15×15 pixel ROI were used to calculate the integral uniformity and the RMS noise level for the uniform section. The relatively high uniformity values are a result of the ramp filter which is inherently noisy.

Mean cts/pixMax cts/pixMin cts/pixInt Unif
19619249751459826.2%
19750239221618219.3%
19134242461471524.5%
19371243361494023.9%
18785233911459823.1%
19331.82417415006.623.4%

When both the upper and lower energy windows are used the integral uniformity increases significantly. This a result of the subtraction of the scatter counts from the projections.

Mean cts/pixMax cts/pixMin cts/pixInt Unif
1178920709566157.1%
1245118261732642.7%
1213917955566152.1%
1239118513608450.5%
1192120781603955.0%
12138.219243.86154.251.5%

Using a just the lower energy window to estimate the scatter improves the integral uniformity slightly, although the values remain relatively high compared to the uncorrected images.

Mean cts/pixMax cts/pixMin cts/pixInt Unif
135512195167.3253.1%
1389619827816341.7%
1322721870673252.9%
1399919611778543.2%
1351220601761446.0%
13637207727405.247.4%

The noise level in the reconstructed images can be largely alleviated by filtering the images as is commonly done with clinical studies. However, the uniformity of the scatter corrected filtered images will still be greater than the uncorrected images simply because of the loss of counts incurred when the estimated scatter counts are subtracted.

A Wiener 3-D postfilter was applied to the same images resulting in a significant improvement in image noise. However, the scatter corrected filtered images still demonstrated greater non-uniformity and appeared noisier than the uncorrected filtered images.

Evaluation of the ACNP kidney phantom was performed qualitatively on both the filtered and unfiltered images. In all images, both defects were clearly visualized, although the scatter corrected images showed a lower count density and noise was increased significantly. Applying a Wiener 3-D postfilter improved the appearance of the images considerably.

Conclusion

The triple energy window scatter correction method evaluated using the Jaszczak and ACNP kidney phantoms showed decreased count images and increased noise, although contrast was improved. The phantom studies suggest that the triple energy window method may not be well suited for studies involving large distributions of radioactivity such as brain or liver studies because of the poor noise and uniformity properties. This scatter correction method may prove to be more applicable to studies involving smaller discrete radioactivity distributions such as cardiac or renal studies. Planar studies may also benefit from this correction method, although it was not investigated here. The ramp filter used to reconstruct the corrected and uncorrected images is inherently noisy, so the use of more optimal filters in addition to or instead of the ramp filter when reconstructing images should be considered. Further research using more clinically relevant phantoms is needed to further evaluate the noise and uniformity properties of the TEW method.

Bibliography

  1. Ogawa K, Harata Y, Ichihara T, Kubo A, Hashimoto S, A practical method for position dependent Compton scatter correction in single photon emission CT, IEEE Trans Nucl Med, 10:408-412 1991
  2. Ichihara T, Ogawa K, Motomura N, Kubo A, Hashimoto S, Compton scatter compensation using the triple-energy window method for single and dual isotope SPECT, J Nucl Med 34:2216-2221 1993
  3. Ljungberg M, King MA, Hademenos GJ, Strand SE, Comparison of four scatter correction methods using Monte Carlo simulated source distributions, J Nucl Med 35:143-151 1994
  4. Buvat I, Rodrigues-Villafuerte M, Todd-Pokropek A, Benali H, Di Paola R, Comparative assessment of nine scatter correction methods based on spectra analysis using Monte Carlo simulations, J Nucl Med 36:1476-1488 1995
Immediate/Delay parathyroid ratios

Every summer, one or two med students show up at my door looking for help with a research project. They get sent to me by the radiologist they happen to be doing the project for, because I’m the Guy That Knows Stuff about image and data analysis (usually more than they know at any rate).

A few years ago (2001-ish or so), I helped out a med student on an interesting project that eventually became a poster that was accepted at an SNM meeting. A paper was written up and was submitted to JNM but ended up getting rejected for whatever reason.

So, for the sake of posterity and in the hopes that someone else might notice it, or have a similar idea, here is the paper that was submitted.

Note, this version has not undergone any form of peer review, other than being reviewed and edited by the authors. This is the latest version of the paper that I have, and there may have been revisions of some kind made in response to reviewer/editor comments when the paper was originally submitted. Those changes may or may not have made it into this version you see here. Questions and comments about this paper are welcome.

Dual Phase Tc-99m Sestamibi Imaging: Its Utility in Parathyroid Hyperplasia and Use of Immediate/ Delayed Image Ratios to Improve Diagnosis of Hyperparathyroidism

Abstract

Objective: Dual-phase Tc-99m sestamibi (MIBI) imaging is the technique of choice for hyperparathyroidism (HPT), especially for localizing parathyroid adenomas. Prior studies show its utility for detecting hyperplasia is equivocal. Quantitation to differentiate benign cases from hyperplasia and adenoma is introduced as a ratio between immediate and delayed images of counts/pixel (I/D ratio). This ratio should be significantly higher in benign parathyroid vs. hyperplasia. Method: Anterior pinhole and upper thorax images with a LEHR collimator at 20 minutes and again at 2 hours after sestamibi injection were obtained in 53 subjects. Retrospective interpretation of the scans as hyperplastic, adenomatous, or benign by a reader blinded to all data was based on the persistence of diffuse activity in two or more foci, a solitary focus, or no activity on the delayed images. These were compared to pathology when available. Regions of interest over the thyroid and background were drawn on immediate and delayed anterior pinhole images, and background subtracted counts/pixel were calculated. Immediate/delay ratios (I/D ratio) were computed for all scans and average ratios were calculated for each type of pathology (benign, hyperplasia, and adenoma). The resulting ratios were analyzed with a t-test to determine significant differences between ratios. Results: Sensitivity and specificity were for parathyroid hyperplasia. Mean I/D ratios were 2.26±0.68, 2.80±0.95, and 3.10±0.77 for subjects with hyperplasia, adenoma, and benign parathyroid respectively (hyperplasia vs. benign P=0.020, adenoma vs. benign P=0.381, hyperplasia vs. adenoma P=0.033. Thyroid ratio data was found to be somewhat independent of the time delay between immediate and delay image acquisition. Conclusion: Dual phase Tc-99 sestamibi imaging is more sensitive and specific for parathyroid hyperplasia than previously reported, supporting its use to localize hyperplastic glands preoperatively and help guide resection. A thyroid ratio between immediate and delayed images will aid in distinguishing hyperplasia from benign parathyroid in uncertain cases.

Keywords: hyperparathyroidism; 99mTc sestamibi; dual-phase parathyroid imaging

Introduction

Primary hyperparathyroidism has an incidence of 100-200/100,000 in the general population. The etiology is unknown, but, data from parathyroid ademomas and hyperplastic glands support a genetic cause linked to chromosome 11, which is also implicated as the cause of MEN I. Ninety-five percent of cases of primary hyperparathyroidism are caused by an adenoma (80-85%) or hyperplasia (10-15%)1. Adenomas are nearly always solitary. Hyperplasia usually involves all four glands, but can involve two or three and occur with varying degrees of asymmetric glandular involvement. Secondary hyperparathyroidism is another cause of parathyroid hyperplasia, often resulting from chronic hypocalcemia in the setting of renal failure and resolving when the hypocalcemia is corrected as with renal transplant. However, transplant failure can result in recurrent hyperparathyroidism that may require parathyroid removal2.

Parathyroid imaging is important for preoperative localization of hyperfunctioning parathyroid tissue. Originally advocated for patients who underwent previous neck exploration and had persistent or recurrent hyperparathyroidism, preoperative parathyroid imaging has proven to be beneficial for identification hyperfunctioning glands because it reduces operative time, costs, and failure rates. Past imaging techniques have involved Tl-201 and Tc-99m pertechnetate, and Tc-99m sestamibi with I-123. Currently, a single radionuclide, dual-phase Tc99m sestamibi imaging protocol is accepted as the standard for localizing hyperfunctioning parathyroid tissue given its combined sensitivity and cost effectiveness3,4,5. Tc-99m sestamibi (Cardiolite; DuPont Pharma, Billerica, MA) has a high affinity for thyroid and parathyroid tissue and a clear differential washout between thyroid and parathyorid tissue. Studies using this technique for initial preoperative detection of parathyroid adenomas have shown sensitivites and positive predictive values ranging from 82-100% and 89-100% respectively. However, results from studies using dual phase Tc-99m sestamibi for preoperative diagnosis of parathyroid hyperplasia have been poor with sensitivities ranging from 37-80%6,7,8. One group reported a sensitivity of 84% recently for detecting adenomas using a criterion whereby two or more foci of prolonged retention of radiotracer was interpreted as hyperplasia9.

We believe dual-phase Tc-99m sestamibi to be more sensitive than previously reported for parathyroid hyperplasia. Thus, we designed a study with two purposes. First, we aim to show dual phase Tc-99m sestamibi imaging is more sensitive than previously reported using a larger patient population than has been used in the past and using more updated interpretive criteria. Secondly, a quantitative ratio is introduced using a thyroid region of interest on the immediate and delayed images to differentiate between parathyroid hyperplasia, parathyroid adenoma, and benign parathyroid when the diagnosis is unclear from image interpretation alone. The immediate/delay image ratio (I/D ratio) is expected to be different for benign, hyperplastic, and adenomatous parathyroid. At 10-15 minutes after injection, there is uptake of Tc-99m sestamibi in both the thyroid and parathyroid glands. Since sestamibi washes out of the thyroid much faster than the parathyroid, the I/D ratio for a benign parathyroid scan should be fairly high and greater than one. In cases of parathyroid hyperplasia, residual activity in the parathyroid glands would result in slightly higher activity during the delayed imaging, resulting in a slightly lower I/D ratio. For parathyroid adenomas, small intense regions of focal uptake would result in higher residual activity, and therefore lower I/D ratio compared to the benign case but higher than the hyperplasia case. The expected values for the I/D ratio are summarized in Table 1.

DiseaseI/D Ratio
Benign>> 1
Hyperplasia> 1
< benign
Adenoma> 1
> hyperplasia
< benign


Materials and Methods

A retrospective study of 54 patients (34 female, 20 male) who underwent dual-phase Tc-99m sestamibi imaging in our nuclear medicine department between February 1997 to March 2001 was performed. The average age of patients was 53.3±15.6 years (range 16-86 years). There were 8 (14.8%) benign cases (normal scan or negative pathology) including, 21 (38.9%) parathyroid hyperplasia (positive pathology or positive scan) and 25 (46.3%) parathyroid adenoma (positive pathology).

Dual Phase Parathyroid Imaging Protocol

Parathyroid images were acquired using a dual phase imaging protocol with patients receiving 740 MBq (20 mCi) Tc-99m sestamibi. Images were acquired at 20 minutes (immediate phase) and 2 hours (delay phase) post injection. Immediate phase imaging consisted of a 5 minute anterior pinhole image followed by a 5 minute image of the upper thorax using a low-energy, high-resolution parallel hole collimator. Imaging for the delay phase consisted of the same acquisitions as for the immediate phase plus additional 5 minute right and left anterior oblique pinhole images. All images were acquired using a 256×256 matrix on a dual head gamma camera (Picker PRISM 2000, Marconi Medical Systems, Cleveland, OH).

Images of all patients were retrospectively interpreted by a board certified nuclear medicine physician blinded to the clinical diagnosis and histopathology results when applicable. Scans were interpreted for hyperfunctioning parathyroid tissue as follows: prolonged retention of radiotracer on the delayed images relative to thyroid activity appearing as a solitary focus was interpreted as an adenoma; two or more foci of persistent radiotracer activity on delayed images as hyperplasia; no radiotracer retention on delayed images relative to thyroid activity was considered a normal scan/benign parathyroid.

Bilateral neck exploration and parathyroidectomy was performed on 46/54 patients. Resected parathyroid tissue specimens were submitted for pathological examination to obtain a definitive diagnosis. A scan was considered true positive if it showed a solitary focus of activity on delayed imaging corresponding to the location of the adenomatous tissue resected and found to be parathyroid adenoma on histopathology, or if it showed multiple foci of activity on delayed imaging corresponding to the locations of hyperplastic tissue resected and found to be hypercellular parathyroid on histopathology. Scans were also true positive if no activity focus was seen and parathyroidectomy was performed anyway, and specimens were found normal by histopathology.

Thyroid ROI Analysis

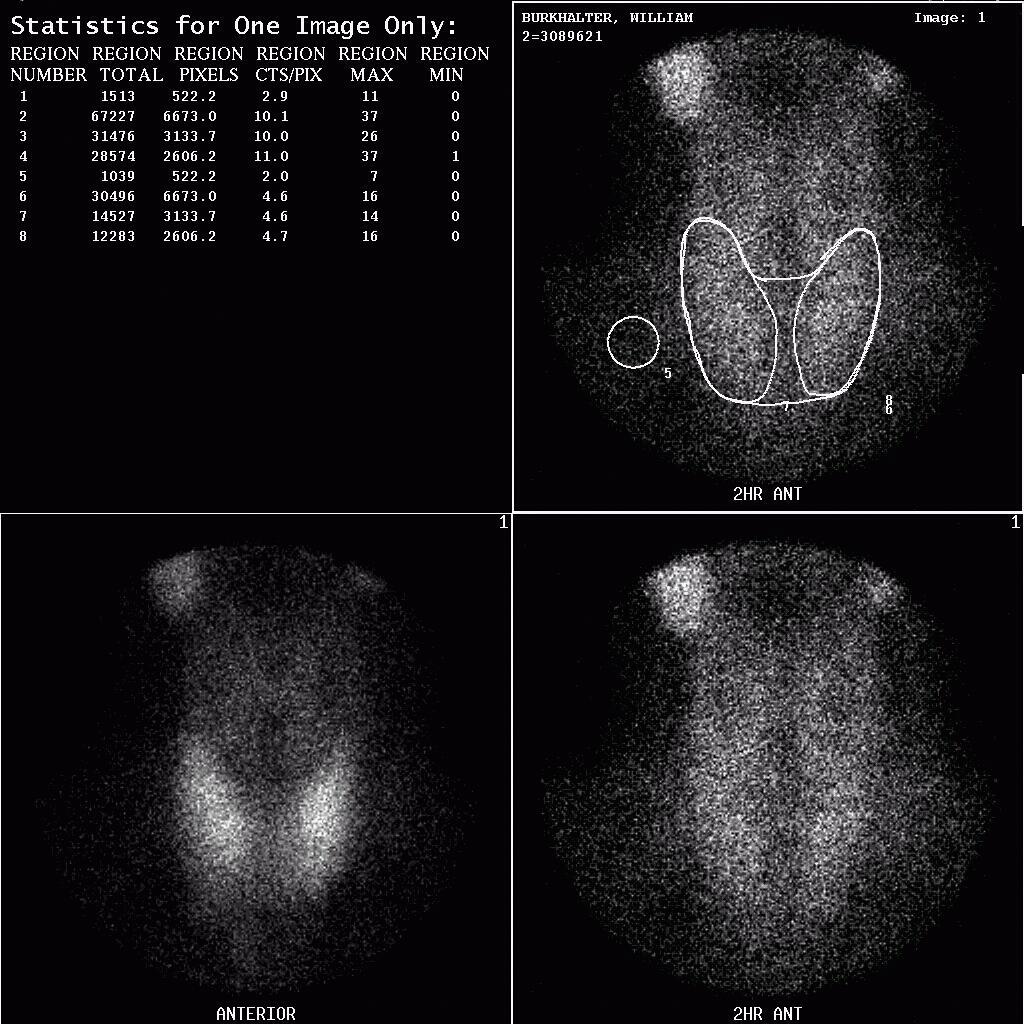
Images were analyzed using the Picker Odyssey (Marconi Medical Systems, Cleveland, OH) workstation platform. Only the immediate and delay anterior pinhole images were analyzed for this study. Regions of interest (ROI) were drawn over the thyroid on the immediate and delayed images (Figure 4). The counts per pixel were calculated and background subtraction was performed for each region. An I/D ratio was calculated by dividing the background subtracted immediate thyroid region counts/pixel by the background subtracted delay thyroid region counts/pixel. For each pathology (benign, hyperplasia and adenoma), average I/D ratios were calculated for the thyroid region. The results were analyzed using a two-tailed Student’s t-test to determine the significance of the differences in the ratios between benign and hyperplasia, benign and adenoma, and hyperplasia and adenoma.


Results

The sensitivity and specificity of dual phase Tc-99 sestamibi parathyroid scans was found to be 82%/96% and 91%/88% for parathyroid adenoma and parathyroid hyperplasia respectively in 46/54 patients who underwent parathyroid resection. Figures 1, 2 and 3 show examples of true positive scans for parathyroid adenoma, hyperplasia, and benign from the study patient population.

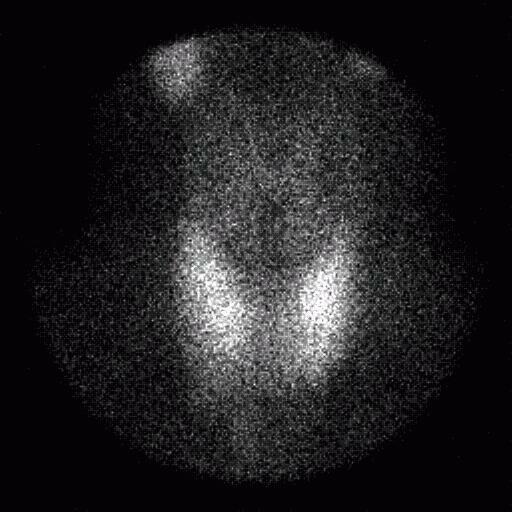
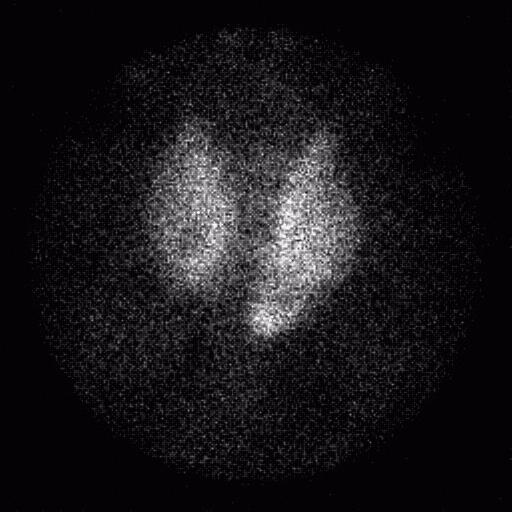
Figure 1: Dual phase images from a patient diagnosed with bilateral hyperplasia confirmed by histopathology after subtotal parathyroidectomy
Figure 2: Dual phase images from patient with NM diagnosis of left inferior adenoma that was confirmed by pathology after left inferior excision
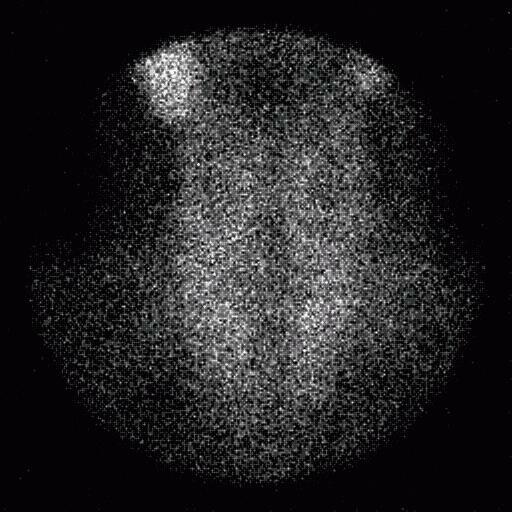
Figure 3: Typical benign dual phase Tc-99m sestamibi parathyroid images

The mean I/D thyroid ratio for benign patients was 3.10±0.77 (range 2.40-4.71). As predicted, the mean I/D thyroid ratio for the parathyroid hyperplasia cases was lower (2.26±0.68, range 0.78-3.73) than the benign ratio. For adenoma cases, the mean I/D thyroid ratio was 2.80±0.95 (range 1.07-4.72), also as predicted. Figure 5 shows a graph of the I/D ratio data and illustrates the range in the calculated ratios. Figure 6 shows a bar graph of the immediate/delay ratio for the thyroid region. Error bars in Figure 6 represent ±1 standard deviation. The average ratios from the thyroid region are summarized in Table 2 for the benign, hyperplasia and adenoma groups. A two-tailed Student’s t-test was performed to evaluate whether the differences in the I/D ratios were statistically significant (P < 0.05 considered to be statistically significant). The difference between the I/D ratio was found to be significant for benign parathyroid vs. parathyroid hyperplasia (P = 0.020) and for parathyroid hyperplasia vs. parathyroid adenoma (P = 0.033). The difference in the I/D ratio for benign parathyroid vs. parathyroid adenoma cases was not significant (P = 0.381). Results of the Student t-test are given in Table 3.


Discussion

The sensitivity and specificity we obtained for parathyroid hyperplasia, equal or exceed other studies (6,7,8,9) to date examining the diagnostic utility of dual phase sestamibi parathyroid imaging for parathyroid hyperplasia prior to parathyroidectomy in which imaging findings were correlated with pathology findings. This study is retrospective, but includes the largest number of patients with proven parathyroid hyperplasia who underwent preoperative dual-phase Tc-99m sestamibi imaging. Given the results for parathyroid hyperplasia using the scan interpretation criteria used, and that dual-phase Tc-99m sestamibi imaging is already established as the best imaging tool with regard to cost effectiveness and diagnostic utility for parathyroid adenoma prior to surgery, we believe dual-phase Tc-99m sestamibi imaging as the diagnostic imaging test for localizing hyperfunctioning parathyroid tissue of any type prior to parathyroidectomy.

Our purpose was to establish a quantitative method to corroborate scan interpretation and distinguish adenomas from hyperplasia when scan interpretation was/is uncertain. Although the differences between the I/D ratios were not as large as initially expected, we believe the differences in mean ratios support using this quantitation method to substantiate scan interpretation in uncertain cases. There is considerable variation in the I/D ratios and the overlap in the range made it difficult to determine a precise I/D ratio for each type of pathology. Part of the variation is a result of normal physiologic differences between patients. More importantly, a larger number of patients with benign parathyroid, adenomas, and hyperplasia would decrease the error for the mean ratios and allow calculation of the I/D ratios to be more a robust diagnostic tool for supporting scan interpretation. Patient and camera positioning differences between the immediate and delay acquisitions also cause variation. In some cases, the delayed images were acquired with the camera at a different distance from the patient, or with the patient turned or tilted relative positioning used for the immediate scan. Such differences affect the size and shape of the thyroid region between the two acquisitions.

Another potential source of variation was the time interval between immediate and delay image acquisitions. Although the imaging protocol calls for the delayed images to be acquired two hours post-injection, this was not always possible and some delay images were acquired as long as 3 hours post-injection. The average time between the immediate and delay acquisitions was 1.87±0.36 hours (range 1.20-2.97 hours). Because of the rapid thyroid clearance time reported for Tc-99m sestamibi (27±13 minutes)10, it might normally be expected that increasing or decreasing the interval between immediate and delay acquisitions would affect the I/D ratio. However, a plot of the I/D ratio vs. I/D acquisition interval time (Figure 7) did not appear to be very well correlated. A linear regression analysis performed on the data yielded y = 0.3824x + 1.916 for the line of best fit (R2 = 0.0247), where y was the I/D thyroid ratio and x was the I/D imaging time interval (Figure 6). Thus, the I/D ratio appears to be relatively insensitive to fluctuations in the time interval between immediate and delay image acquisitions. There does appear to be a slight trend towards an increasing ratio as the delay time interval is increased however.

Conclusion

Using more appropriate criteria for scan interpretation, dual-phase Tc-99m sestamibi parathyroid imaging is more sensitive in diagnosing parathyroid hyperplasia than previously reported. In addition, it is appropriate preoperatively in guiding parathyroidectomy for all types of hyperparathyroidism. The differences in the I/D ratio seen between cases of benign parathyroid and parathyroid hyperplasia and between parathyroid hyperplasia and parathyroid adenoma support the use of calculating an I/D ratio to help clarify diagnosis when interpretation is uncertain. However, more precise values for the I/D ratios are needed using an increased number of patients and better control of immediate and delay acquisition parameters. There did not appear to be the expected correlation between the image acquisition delay time and I/D ratio. However, any correlation may have been masked by the wide variations in I/D ratio. A prospective study is currently being conducted to determine a more precise I/D ratio for benign, hyperplasia and adenoma.

References

  1. Heath H, III, Hobson SF, Kennedy MA: Primary hyperparathyroidism: incidence, mortality and potential economic impact in a community. N Engl J Med 302:189, 1980.
  2. Heath DA: Localization of parathyroid tumours. Clin Endocrinol 43:523, 1995.
  3. Majors JD, Burke GJ, Mansberger AR, Wei JP: Technetium-99m sestamibi scan for localizing abnormal parathyroid glands after previous neck operations: preliminary experience in reoperative cases. South Med J 88:327, 1995.
  4. Taillefer R, Boucher Y, Potvin C, Lambert R: Detection and localization of parathyroid adenomas in patients with hyperparathyroidism using a single radionuclide imaging procedure with technetium-99m sestamibi. J Nuc Med 33:1801-7.
  5. Casas AT, Burke GJ, Mansberger AR, Wei JP: Impact of technetium-99m MIBI localization on operative time and success of operations for primary hyperparathyroidism. Am Surg 60:12, 1994.
  6. Light VL, McHenry CR, Jarjoura D, Sodee DB, Miron SD,: Prospective comparison of dual-phase technetium-99m scintigraphy in the evaluation of abnormal parathyroid glands. Am Surg 62:562, 1996.
  7. O’Doherty MJ, Kettle AG, Wells P, Collins R, Coakley AJ: Parathyroid imaging with technetium-99m sestamibi: preoperative localization and tissue uptake studies. J Nuc Med 33:313, 1992.
  8. McHenry CR, Lee K, Saadey J, Neumann DR, Esselstyn CB: Parathyroid localization with technetium-99m sestamibi: a prospective evaluation. J Am Coll Surg 183:25, 1996.
  9. Klieger P, O’Mara R: The diagnostic utility of dual phase Tc-99m sestamibi parathyroid imaging. Clin Nuc Med 23:4, 1997.
  10. Foldes I, Levay A, Stotz G. Comparative scanning of thyroid nodules with technetium-99m pertechnetate and technetium-99m methoxyisobutylisonitrile. Eur J Nucl Med 1993;20:330-333